Author: christy pottroff
GSAS Futures Hosts "Digital Day 2015"
Mark Your Calendars!
We are excited to announce these upcoming events for the Fall 2015 semester:
|
“Minimal Computing” for Graduate Students In this workshop we will immediately link digital humanities to critical theory by looking at the production of our own knowledge within the context of global capitalism and environmental decay. We will accomplish this by reducing the technological stack you can use for your own production to bare minimums that you can both understand and command. We call this type of praxis (theory + making), minimal computing. Specific technologies you will be introduced to: Terminal, Markdown, HTML/CSS, Pandoc, Jekyll & Github. Bring your laptops (Macs & Linux preferred). Alex Gil holds a PhD from the University of Virginia in Caribbean Literature and Digital Humanities, and is the Digital Scholarship Coordinator in the Humanities and History Division of Columbia University Libraries. |
Digital Pedagogy: What it is, Why it is and How to do it We’re often told that our students are digital natives – growing up on and with the internet. At the same time, digital pedagogy seems to flummox many undergraduates, who are familiar with writing papers but not with making websites. This talk discusses approaches to integrating things digital into undergraduate classes, introduces a few useful tools (Omeka, Neatline, Voyant, WordPress) and workshops some solutions to the challenges of digital undergraduate pedagogy. Anelise H. Shrout holds a PhD in History from New York University, and is currently a Mellon Postdoctoral Fellow in Digital Studies at Davidson College in North Carolina. |
|
Social Media as a Professional Platform A roundtable on using social media for professional purposes as an academic, featuring Erin Glass ( Digital Fellow at CUNY Grad Center), who will discuss her emerging project for online graduate student collaboration, “Social Paper.” Other speakers to be determined. |
DH on the Job Market |
Omeka and Digital Collections
Back in February, the HASTAC group Digital Collections hosted a webinar on the use of Omeka in the classroom. As Fordham has recently acquired a license for Omeka, this webinar was incredibly useful in navigating the basics of both Omeka.org and Omeka.com.
One of my current projects attempts to use Omeka to curate a large manuscript tradition with copies spread around the world. The webinar made Omeka much more navigable, and I encourage anyone interested in using Fordham’s license to take a look at the video.
The link to the webinar video is here: https://www.youtube.com/watch?v=sV9xcJMiZ8Y
-David Levine
Spring Break: Digi-Dissertation Edition
Blog post by Christy Potroff
For me, there’s nothing more appealing than an open week in my calendar. That blank iCal space means no lesson planning or grading for my Texts & Contexts course. I don’t have to ride the D-train to the Bronx for a meeting or lecture. It’s a week of sartorial freedom: basketball shorts over khakis, t-shirts over blazers. Most importantly, a break from my weekly routine means I can settle into my home workstation and immerse myself in late eighteenth century seduction fiction—as it relates to my dissertation, of course. As an advanced doctoral student, my expectations for this past spring break were writing-intensive. I had no travel plans and only a handful of social events for the week. I carved out this precious time to write and revise sections of my dissertation.
An open week—like a blank page—can be intimidating. The possibilities seem endless and dizzying. A few weeks ago, I found myself wondering: could I write fifteen pages on epistolary novels for my dissertation group? Would I be able to read Margaretta and The Hapless Orphan during the break? Is an annotated bibliography the best use of my time? Should I start writing that book review? Wait! How is this a “break,” exactly? Will I ever finish House of Cards?
A few days before the break, Fordham medievalist extraordinaire, Boyda Johnstone, had a stroke of brilliance. Boyda organized a week-long online dissertation writing group for graduate students at Fordham and beyond. The purpose of the online dissertation group was simple: we wouldn’t critique one another’s writing; rather, we would focus on accountability in the writing process. Each group member was asked to set daily and cumulative goals for the week, then members would report on their daily and weekly progress. These goals were public, specific, and realistic (i.e. read and summarize 3 articles on notecards; write for 1.5 hours in the morning; notes toward response paper for Hapless Orphan). Throughout the week, we gave each other advice on the writing process, suggestions for professional development, and general motivation for the hard task of writing. In effect, each individual group member spent the week consciously and publicly organizing her time; as a community, we held one another accountable and supported one another.
The tool that facilitated our online writing group was a simple one. Boyda created a shared Google Doc with a template for each group member’s goals. Here’s our group’s template:
Within this template, our goals were specific, but informal. We used the comment function to engage with eachother’s goals. The encouragement was consistent and inspiring. This kind of structured online engagement made me not only more purposeful in my use of time, but I also felt accountable in reporting back my accomplishments.
At the end of each day, I would set the next day’s goals. When I woke up in the morning, I put on my basketball shorts, fed my cat, drank my coffee, and had a clear plan of action for the rest of the day. I was purposeful and supported.
Even though I spent most of the week in academic solitude, I never felt alone. The group happened to be populated by eight graduate student women. Seeing other avatars in our shared Google Doc made me feel like part of a productive and collaborative community of academic women. We were from Fordham University, NYU, University of Alberta, and York University. Despite our geographical and institutional distance, I received daily encouragement from this community and I felt accountable to them. What is more, I encountered writing and research practices and professional development activities beyond the norms at Fordham thanks to the group’s institutional range. Even though our group never met face-to-face (and I don’t know what some of them look like at all), my online engagement with this community heightened my productivity throughout what would have otherwise been a very solitary week. While I certainly wouldn’t advocate for an all-digital academic community, this was a positive and productive experience enabled by a simple digital tool.
Time is the most precious commodity in graduate school. Time management is a difficult skill to learn—but it’s not something you need to learn alone. The next time you feel disoriented by an open calendar, take to the internet! Create an online group of like-minded friends. Make specific public goals for how you’ll use your time and hold one another accountable.
Choosing between ArcGIS and QGIS in the Classroom
Last October, I co-led a seminar on Spatiality and Digital Mapping. We focused on the conceptual side of digital mapping, going through concepts, theory, and the evolution of the field. Our aim was to expose the audience to the concepts and programs with the intention of following up with one or more intensives on the programs garnering the most interest. Afterwards, there were clear winners: CartoDB and ArcGIS. with secondary interest in Google Earth/Maps.
For anyone who has worked on these programs, do you think it would be worthwhile to teach intensives on each program separately? Or are the concepts close enough? My plan now is to separate them, but to advertise the courses for specific audiences. CartoDB, for example, would be with people who really just need visual analysis and little to no high-level analysis. For ArcGIS, the intended audience would be those less interested in publically-accessable visualizations and more interested in quantifiable analysis. Google Earth could go either way, though I think that course could be taught much more quickly than the other two – certainly faster than Arc.
Does this make sense? and would there be interest in the NYC area for non-Fordhamites to attend these courses?
-David Levine
Response from Jessica Breen:
I’d suggest teaching them separately, with the ArcGIS session followed by a CartoDB workshop. Folks who just want to plug and chug some data into a good-looking map aren’t likely to want to devote the time needed to learn Arc, but just because somebody wants to use the analytic tools of Arc doesn’t mean they don’t want an attractive map at the end…and Arc is useless for making anything even remotely as attractive as what CartoDB makes just by default.
I’d also encourage you to maybe look at QGIS instead of ArcGIS if you’re going to teach a desktop GIS. I switched the intro to GIS course I teach over to QGIS from Arc this semester and it’s been great. All of my students are able to use the program on their home computers regardless of what operating system they run and instead of losing access to the program when their student license runs out, they can keep Q forever since it’s FOSS. It has meant that I had to learn a couple of QGIS quirks…projections are treated entirely differently than in Arc and Composer, the map editor in QGIS, is just as wonky as the editor in Arc, though in it’s own unique way…but that’s the case with any software package.
As for non-Fordhamites who might be interested in attending, you might get in contact with the MapTimeNYC folks. They hold regular community meetups for learning web mapping tools and techniques. They’re on Twitter as @MapTimeNYC.
2014-2015 HASTAC Scholars: Call for Applications
Deadline for applications: August 25, 2014
Announcement of Award: September 3, 2014
Are you a graduate student engaged with innovative projects and research at the intersection of digital media and learning, 21st-century education, and technology in the arts, humanities and sciences? Would you like join an international conversation about the digital humanities? If so, you are invited to apply for the opportunity to become a 2014-2015 HASTAC scholar. As a Scholar, you will represent Fordham University at HASTAC’s prestigious, online community. Two successful candidates will each receive a $300 honorarium from the office of the Dean of GSAS.
HASTAC (pronounced “haystack”), which stands for Humanities, Arts, Science, and Technology Advanced Collaboratory, is an interdisciplinary, international network of undergraduate and graduate students, faculty, as well as librarians, archivists, museum curators, publishers, and IT specialists. Members of the HASTAC community blog, host forums, organize events, and discuss new ideas, projects, and technologies that reconceive teaching, learning, research, writing and structuring knowledge. For more information about HASTAC Scholars and to see their discussion forums, please see the HASTAC Scholars website and also this page.
Successful candidates will:
- Remain in good standing with the university.
- Give one workshop centered on integrating digital tools into the classroom or research. The workshop will be open to the campus community and given by April 2015.
- Be an active participant in the Fordham Graduate Student Digital Humanities Group by leading or planning one or more events related to the digital humanities, including workshops, speakers, and/or reading groups.
- Frequently engage, according to your interests and abilities, in the discussions taking place on the HASTAC website, as well as related events taking place during the year.
- Between September and May, contribute no fewer than two posts per semester to the HASTAC Scholars blog and to the Fordham GSDH (These may be cross-posted.)
- Report your activities at least twice a semester to a faculty mentor to be assigned to you.
Applications will be evaluated based on the scholar’s activities in the areas of digital humanities research, pedagogy and technology, and service to the community. Highly motivated students with limited exposure to the digital humanities are encouraged to apply. This opportunity is an excellent way to learn more about digital media and practices.
To make the application, please answer the following the questions:
- Why do you want to become a HASTAC Scholar?
- How will being a HASTAC Scholar support your current work at work Fordham? Please speak to this question in terms of both your teaching and research, noting your experience with digital humanities research and pedagogy.
- What strengths and experience can you contribute to the HASTAC community?
Your application must include a brief recommendation from a faculty member who can speak to your scholarship and ability to collaborate with others, both in person and online.
Send applications and recommendations as Word Documents to Dr. Elizabeth Cornell, cornellgoldw_at_fordham. edu, with “YOURLASTNAME-HASTAC APP” as the subject line. Applications are due no later than 5:00 PM, August 25, 2014. Members of Fordham’s faculty Digital Humanities Working Group will review applications and two scholars will be announced no later than September 3. Selected scholars should make an application at the HASTAC website by September 10. Details for that procedure will follow if you are selected.
Mapping Religious Concern in the Later Middle Ages: Software Ups and Downs for DH Visualizations
By Alisa Beer
At the final meeting of the Digital Humanities Graduate Group on April 23rd, Alisa Beer (that’s me) presented “Mapping Religious Concern in the Later Middle Ages.”
Jacqueline Howard followed with her presentation on the Bronx African American History Project and Digital History, which she wrote a blog post about for us. Since Jacqueline already posted about her topic, I will focus on my own presentation’s topic.
Mapping Religious Concern in the Later Middle Ages: Software Ups and Downs for DH Visualizations
My presentation derives from work I did for my MA thesis, Guido de Monte Rocherii’s “Manipulus Curatorum”: the Dissemination of a Manual for Parish Priests in the Fourteenth and Fifteenth Centuries.
The Manipulus Curatorum, or Handbook for Curates, is a text that instructs priests in their duties. It survives in 261 identified manuscript copies, the majority of which are either undated, or dated to the fifteenth century. This is, as medievalists reading this blog will recognize, a very large manuscript survival.
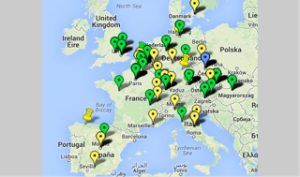
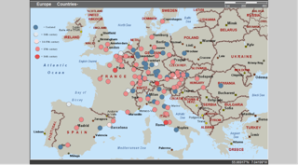
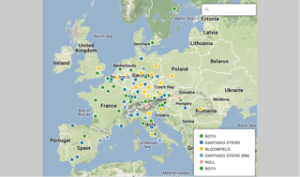
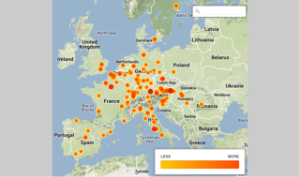
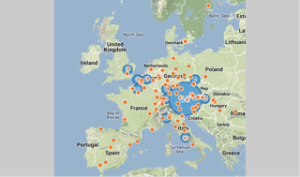
In order to figure out where this text may have been used, or at least, where its manuscripts are currently housed, I created a Google Map, in the fall of 2012. Then I used Microsoft MapPoint, in the spring of 2013 to create a similar map, and finally, in the spring of 2014, I tried CartoDB. The features of each differed, at the points at which I used them, and in this post I will discuss the ways in which each helped me to visualize my data and to get more information out of my spreadsheet of manuscripts in different ways.
This was helpful because it was:
–Easy to learn and to use, if time-consuming,
This was less helpful because it:
–Didn’t handle multiple pins in the same location well
–Did not import spreadsheets at the time I was using it (Fusion Tables has changed all of that!)
–Did not have many display options
This was helpful because it:
–Allowed for shading by density of points, which helped me see where the manuscripts were most concentrated.
This helped me to form a better view of where the manual had collected in the years since 1500. This was a fairly transformative realization, since it helped me focus my research geographically in ways that would have been harder had I relied on a spreadsheet and a general sense of how many were in Germany vs. Austria vs. England.
–Allowed for differentiation by features (such as date).
This allowed me to see, visually, exactly how many of the manuscripts were undated vs. fifteenth century, and how very rare the fourteenth-century manuscripts were, though I already knew that, and it wasn’t exactly a transformative realization.
–Imported data from a spreadsheet.
Oh, so lovely not to have to put every pin in by hand, and to be able to update the spreadsheet, re-upload the data, and not have to worry about finding the right pin and changing it individually.
Downsides included:
–A less-than-ideal visual display.
I am not a fan of its graphics. They’re fine, but they’re not appealing to me at all.
–A difficult user interface.
I found it cumbersome to work with, at best. I achieved my goals with it, but only by dint of stubbornness, online searching for help topics, and a good deal of wasted time.
–A very expensive paid version: $299.99, and a slightly hobbled trial version.
Enough said.
CartoDB
I liked CartoDB best of the options I tried because it:
–Has very flexible display options.
This was lovely. I was able to choose colors, map backgrounds, and other options, in order to visualize in the way I found most clear and helpful. This transformed my understanding of how the manuscripts moved, since I could see “only” thefourteenth-century ones, only the fourteenth-to-fifteenth-century ones, etc. I look forward to creating an animation of the spread of the printed editions using CartoDB, because it will be incredibly helpful, compared to a similar animation of the spread of printing in the same time period.
–Imported data from a more complex spreadsheet than MapPoint.
I was able to import my entire spreadsheet and select data displays that were more complex than I managed in MapPoint. This allowed me to differentiate between a wider variety of dates, for example, and to add extra criteria, or otherwise display information that MapPoint and Google Maps were unable to help me with (at the time at which I used them.)
–Was accessible online on any computer.
Downsides include:
–The need to sign up for an account, and limited functions of a free account, including the public visibility of free account data.
This didn’t deter me, but I think it might make some a bit leery. I’m also perfectly happy to have my data be publicly visible, but I know many people are not.
–The need for internet access.
While not always a problem, when my internet went out, I was very unhappy not to be able to use CartoDB at all.
–The cost of a paid plan — the least is $29.99/month.
This is, annually, more than MapPoint. And it’s a subscription service, so you have to keep paying for it.
Summary
While I like CartoDB better than the alternatives, I’m still going to keep an eye out for open-source mapping software, and try my hand at Omeka’s mapping options, because I’m not content to pay $29.99/month for the ability to have more than 5 tables. At the moment, I don’t need more than 5, but I’d like to have a better sense of what’s out there before I subscribe to any program.
Thoughts? Comments? Suggestions of other mapping software? All would be more than welcome!
Matthew Jockers: Digital Methods and Literary History
Reminder! Today at 12:30, in Dealy 203, our very own Patrick Burns will be leading a book discussion on Macroanalysis: Digital Methods and Literary History by Matthew Jockers.
This is a fascinating read with really interesting implications for literary applications of DH — we look forward to seeing you there!
Upcoming Meeting: Can DH Get You A Job? A Presentation and Discussion of DH Job Descriptions
Mark your calendars! The next FGSDH meeting is in only a few days!
Can DH Get You A Job?
A Presentation and Discussion of DH Job Descriptions
February 26th, 12:30pm
Dealy Hall 115
Come discuss Digital Humanities job postings. Bring one you’ve seen recently, or come to hear more about them and what they want. We’ll discuss what skills DH jobs want, how to read the job postings, and how to make them less intimidating and/or mystifying. We’ll also discuss ways to acquire the skills they want, and how to go about doing so at Fordham and in NYC.
As a reminder: never let “not having done the homework” prevent you from coming to a FGSDH meeting! We’re delighted to see you, and more voices in discussion are always valuable.
–Alisa and Patrick


