Topics in Digital Mapping: Georectifying Maps and Using Map Warper, Meeting Report

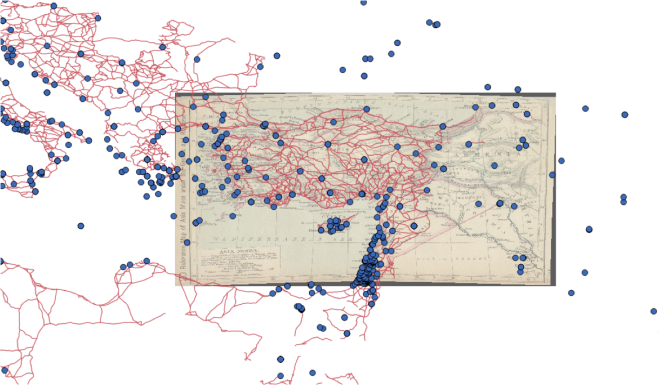
In the third installment of our Topics in Digital Mapping Workshop Series, “Georectifying Maps and Using Map Warper,” David Wrisley demonstrated georectifying to participants, showing us how to code maps and other images onto digital coordinates. David offered many possibilities for why one might want to georectify a map, including:

  • Organization of a catalog by spatial metadata

  • Mining information from analog data

  • Definition of borders that aren’t political or topographical

  • Rethinking the relativity of spatial representations and coordinate systems from an intentionally warped image

  • Map deformance, a way of thinking through the relative spatiality of documents that resemble maps

  • Or just for a nifty background to one’s own map

David also introduced us to some of the tools for georectifying, including the data format Keyhole Markup Language (KML or KMZ) and OpenStreetMap, an open access, collaborative project by rebellious mappers who chart neighborhoods for the public. Workshop participants then practiced georectification with NYPL’s Map Warper, using an 1873 map of Painted Post, NY, found at http://maps.nypl.org/warper/maps/11615.

For a list of links from this workshop, please visit http://www.tinyurl.com/fordhammapping9.

Blog post by Heather Hill, MVST student at Fordham University

Topics in Digital Mapping: Timelines and Palladio Meeting Report

Digital map makers are often interested in animating the spatial visualization over time or linking their maps to a timeline.  This session provided participants with examples of animations and timelines using Neatline and GeoTemCo.  The workshop also covered data formats and how time and mapping can be combined in Palladio, a free, web-based visualization platform designed for the humanities. All of the information provided to participants is available in a google doc.

We opened with examples of animated map visualizations. Two of particular interest are the Islamic Urban Centers project and the Atlas of Early Printing. While creating an animated visualization was not covered, these projects give a good idea for what the integration of time into our datasets can be used to do.

Abigail Sargent, MVST student, gave a brief presentation on the French of Italy NeatLine exhibit, a project that uses Omeka’s NeatLine plug-in to visualize the locations and dates of medieval French texts of Italian origin.

We then moved into talking about Palladio, and what each of the three main presenters are using it for. David Wrisley introduced participants to the idea of point-to-point data, of seeing the relationships of pieces to things in medieval texts. David Levine demonstrated some of the limitations of Palladio by pulling up a very large data set about medieval woodland and demonstrating how Palladio’s visualizations and network mapping can be useful. Alisa Beer drew on her research into medieval English libraries and demonstrated how Palladio can map points geographically as well as how the timeline function can be used.

We then broke into small groups and trouble-shot an intentionally broken data set, and then had participants create a .csv file based on Amtrak time tables from 1971, including the trip from New York to Boston.

Once participants had created a .csv file, we uploaded to Palladio and discussed the point-to-point map we had created!

Palladio Amtrak Image

Interested in learning more about Palladio?
Check out Miriam Posner’s tutorial to Palladio. Then open this google doc for participants, where you will find an intentionally broken data set to fix and upload into Palladio!

Topics in Digital Mapping: Getting and Organizing Spatial Data

Roman_Roads

The first workshop for the Topics in Digital Mapping Series was yesterday, January 21st.  David Wrisley introduced us to a variety of tools and ideas related to the process of getting and organizing spatial data. Participants were encouraged to try porting .csv files into Google Maps and to compare the visualization options with those available from CartoDB, which will be the subject of Workshop four in this series.

All participants were encouraged to create a data set for themselves for the next workshop, on February 11th, with 25 points and a temporal element, so they can map a topic of personal interest in Palladio.

All slides from the talk are available for download at http://tinyurl.com/fordhammappingday1